Dashboard
The dashboard is the main place to observe the selected application's runtime status, request trends, and abnormal traffic. It is written for daily platform users and does not require API-level knowledge.
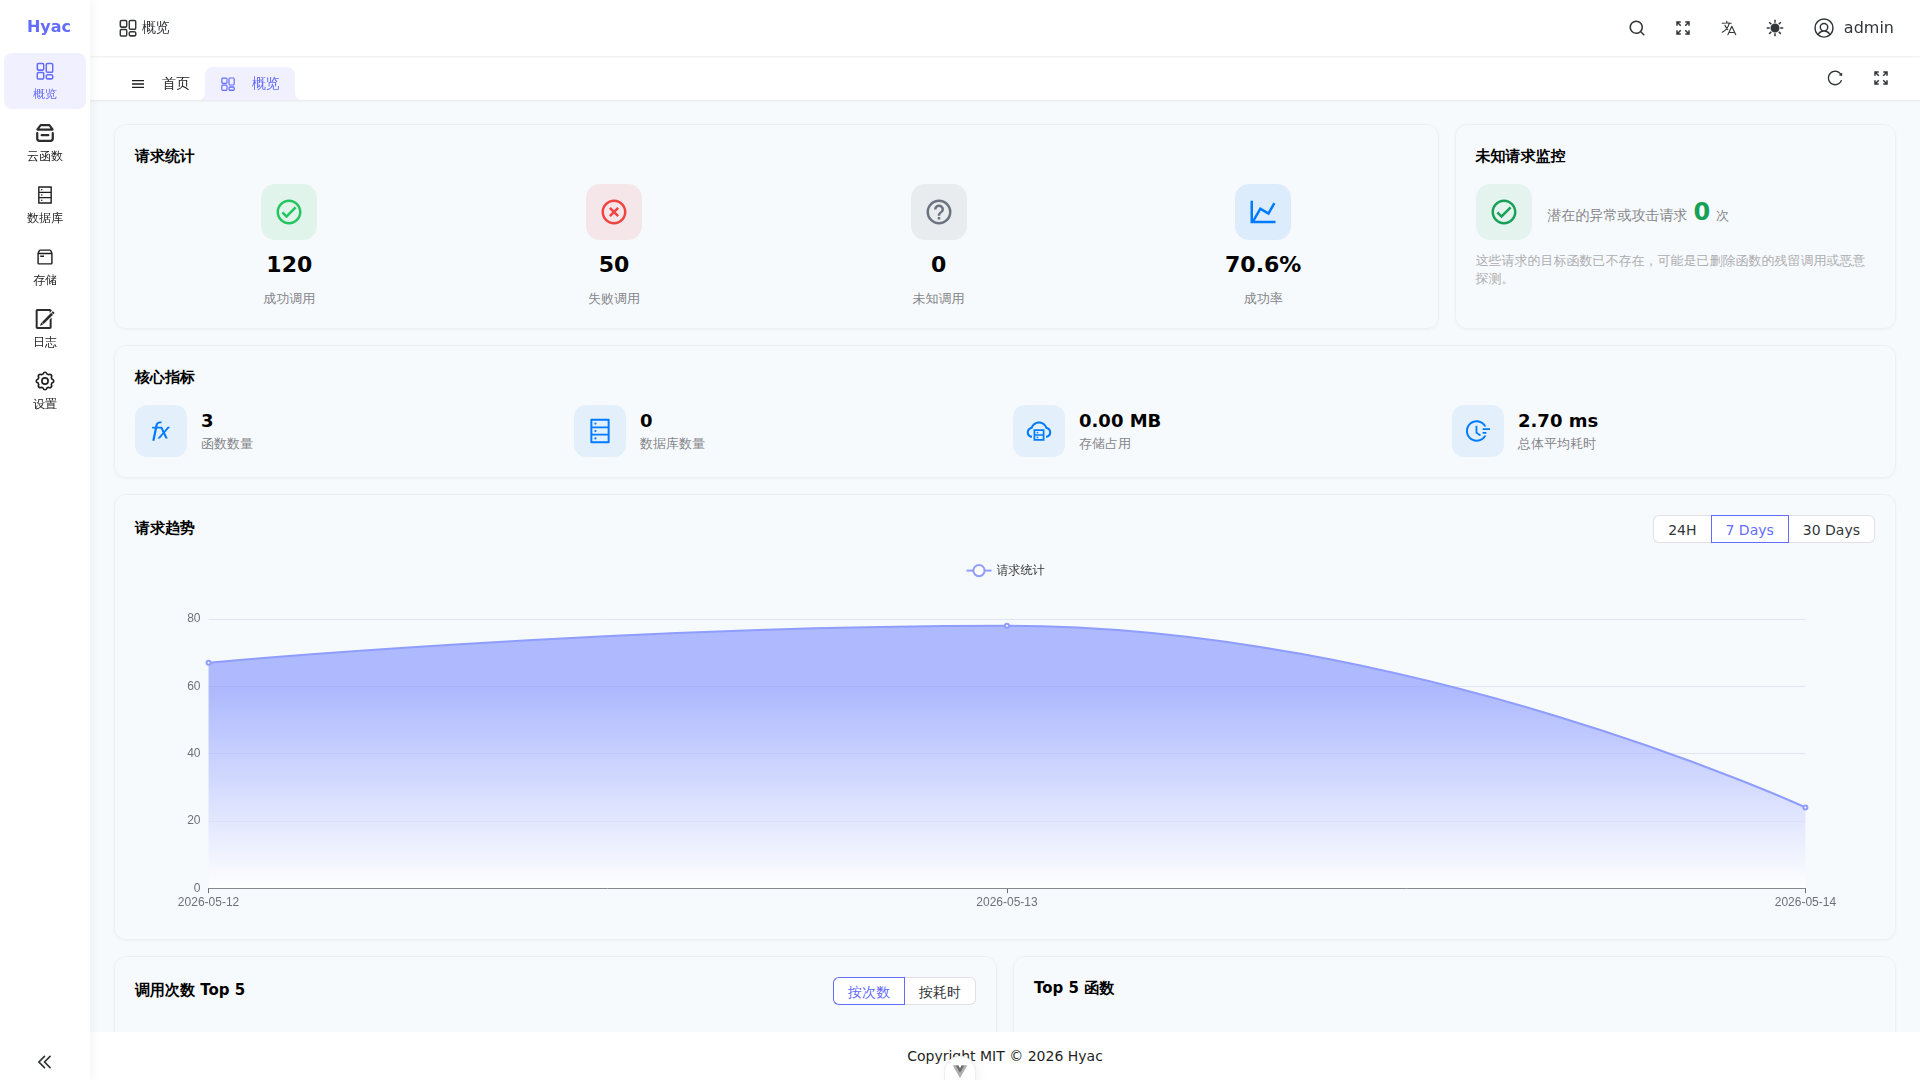
The screenshot was captured from a real 1920×1080 console window. The main areas are request statistics, unknown request monitoring, core metrics, request trends, and function rankings.
Open the Dashboard
After signing in to the console, open "Dashboard" from the left menu. The dashboard always follows the currently selected application. When you switch applications, all statistics are loaded again for the new application.
If no data is displayed, check that:
- An application is selected.
- The application has been invoked at least once.
- The application runtime container has started. Its name usually follows
hyac-app-runtime-<lowercase_app_id>.
Status Area
The top area highlights function status and unknown requests.
- Function status helps you understand whether the selected application has usable functions and whether errors are concentrated in the runtime.
- Unknown requests help you find calls to missing functions or wrong paths.
If unknown requests keep increasing, first verify the external call address:
https://<app_id>.<DOMAIN_NAME>/<function_id>
app_id comes from Application Management, and DOMAIN_NAME comes from the deployment environment.
Summary Cards
Summary cards show the application's current load, including calls, success/failure status, and recent changes. They are useful for operational observation, but they are not a precise audit report.
If numbers do not match expectations, also check:
- The function test result in Function Management.
- Runtime logs in the function detail page or Logs page.
- Docker logs for the runtime container.
In a development environment:
docker logs -f hyac-app-runtime-<lowercase_app_id>
Trends and Rankings
Trend charts show request changes over time. Ranking lists help identify the most frequently invoked functions or functions with concentrated failures.
Common use cases:
- Confirm whether a newly published function is receiving traffic.
- Locate the function responsible for most failures.
- Verify whether unknown requests decrease after fixing an integration.
FAQ
The dashboard is empty
Confirm that the selected application has been invoked. If no function has ever run, the dashboard may show an empty state.
The application domain is reached, but the function does not run
Check whether the path includes the function ID. The subdomain selects the application, while the path selects the function.
The first request is slow
Application runtime containers are started on demand. On the first request, Server creates hyac-app-runtime-<lowercase_app_id>, waits for the health check, and then forwards traffic. Later requests go directly to the running container.